Back to Open Urban Mapping, — open building footprints datasets. We continue publishing the data produced by the Geoalert platform, this time for the Russian regions of Chechnya and Tyva.
The problem is as follows: no one knows how many residential buildings there are in Russia, how many of them are abandoned, and how many private houses are not publicly registered. And those numbers could come in handy on various occasions, from conducting a census to selecting a location for a new grocery store.
OpenStreetMap (OSM) is the most widely used resource for getting geographical data in Russia. At Geoalert, we attempt to apply AI to help fill in the gaps in OSM, and we’re currently focused on residential areas. This is what the Facebook RnD team has called “AI-assisted mapping”.
Read about our first open data contribution to three Russian regions.
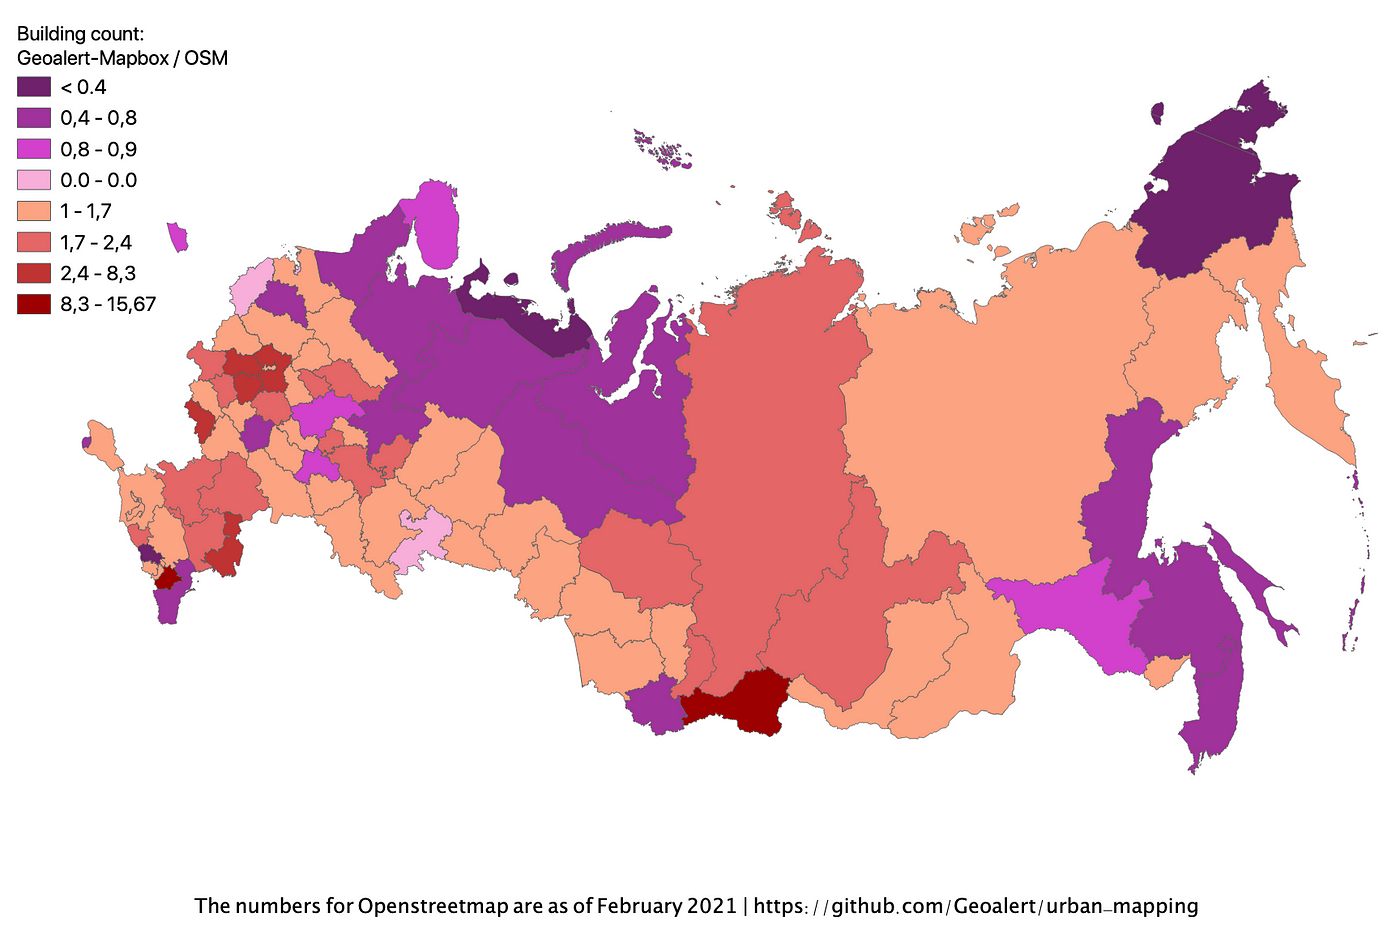
After the first try, we rated the regions of Russia according to the ratio of our building count to the number of buildings in the OSM for the same region(as of early 2021). The results varied from 10 to -2.5, i.e. for in some regions we detected up to 2.5 times fewer buildings than there were in the OSM, for others — up to 10 times more. Most regions where we score poorly are characterized by the poor quality of Mapbox Satellite imagery that we used for detection (low resolution/black&white/cloud cover). Mapbox drastically updated its imagery in 2020, so we reprocessed some regions, depending on the community demand and their coverage in the OSM.
The Republic of Chechnya — updated
Chechnya is a rather rural region situated in the Russian North Caucasus. It has the poorest coverage in the OSM among all regions of Russia, when it comes to buildings. Only the capital city of Grozny is thoroughly mapped, while most other municipalities only have administrative boundaries and main roads. Neither is the coverage better for Chechnya in the commercial maps such as Google, 2GIS, or Yandex Maps, which normally have the most detailed data for Russia.
Last time, our model extracted only 220K buildings from Mapbox Satellites imagery. This time, it performed much better, yielding up to 540K buildings thanks to better input imagery. We updated the building count in the statistics by administrative boundaries (for settlement boundaries we used the OSM as well). We invite you to play around with the statistics and the data, so you could discover more insights regarding the populated areas in the region.
You can find all the data in the table via the following link. Here are a few highlights:
- 173/427 settlements that have administrative boundaries in the OSM have no buildings in both our processing output and the OSM. Some of them look like empty places, others were most likely abandoned after one of the military conflicts in the 90s early 00s.

The overall statistics of building ratio by place.

In general, we came to the same conclusion as we did last time — using automatically generated data like ours is always a trade-off between the desirable quality of the cartographer’s manual work and the time spend on it. The government spends a lot of money trying to maintain the registries but we can see that in some regions these registries are completely out of the date.
Honestly, we discovered the weak reaction of the Russian OSM community to the first publication of our open datasets. As for the US, we see a significant impact of mapping imports made by the use of the Miscrosoft’s building footprints within a short period of time.

Hopefully, further updates and improvements in Open Urban Mapping will prompt more mappers to follow the project, fill in the gaps in the map, and validate the existing data. “The map is never complete”…
References
- GitHub
- Wiki OpenStreetMap (EN)
- Open Urban Mapping — read more
- Open Urban Mapping — statistics
- Mapflow.ai — The Geoalert platform for AI-mapping